
Overview
Objectives
The Directorate delivers quality ACT public school education and early childhood education to shape every child’s future and to lay the foundation for lifelong development and learning. The Directorate works in partnership with students, parents and the community to ensure that every child and young person in the ACT will benefit from high quality, accessible education.
In addition to providing public school education and early childhood education, the Directorate is responsible for the regulation of education and care services, registration of non-government schools and home education. Through this role the Directorate also facilitates the provision of quality education services across the ACT.
A broad range of services and activities are delivered by the Directorate under five domains:
- Quality learning – ensuring learners have access to powerful and relevant learning experiences;
- Inspirational teaching and leadership – building the capabilities of our teachers and leaders;
- High expectations, high performance – having high expectations for all and meeting the learning needs of every student;
- Connecting with families and the community – partnering with families and engaging with the community to build meaningful relationships; and
- Business innovation and improvement – improving our business systems and being open and accountable for our decisions.
Risk Management
The development of the Directorate’s annual Strategic Risk Management and Audit Plan identified risks that could impact on the Directorate’s operations and objectives. The key risks provided below are medium to long-term risks that are monitored by the Directorate’s executive and senior management.
Key risks, including mitigation strategies, are identified below:
1. Inadequate planning, prioritisation and implementation of system reforms.
The Directorate has a strong project management culture; has rigorous project management around complex reform programs (such as project planning for the Student Resource Allocation and Student Administration System reform programs) and has comprehensive corporate governance processes. In 2017, the Directorate established a Reform Program Board to strengthen governance and oversight of complex reform programs. In 2018 the Directorate is investing in building a stronger corporate planning and reporting capability.
2. Lack of workforce capability and increasing efficiency demands to deliver core education services and strategic reforms.
The Directorate has a comprehensive professional development planning process in place and provides professional learning opportunities to staff. For example, all Directorate staff are required to have a professional development plan and undertake professional training. The Directorate is continuing to implement initiatives to reduce teacher workload.
3. Insufficient stakeholder engagement and management of stakeholder expectations.
The Directorate provides alignment through key strategic documents including the Directorate’s Strategic Plan 2018-21: A Leading Learning Organisation. The Strategic Plan is communicated to schools and the community, and schools are supported in ensuring alignment through system wide planning processes. The Directorate has established a comprehensive communication strategy to engage students, families and the community around the Future of Education in the ACT.
4. Inadequate prevention, preparedness and response to environmental threats, including:
- Occupational violence;
- Physical security threats;
- Bushfire;
- Violent extremism;
- Terrorist attacks; and
- Workplace health and safety incidences.
The Directorate has undertaken a number of actions to continue to improve safety in the workplace, including hosting occupational violence risk workshops, raising awareness of workplace health and safety obligations of staff and delivery of refresher training for school principals and staff. In 2017 the Directorate developed an ACT Education Directorate Managing Occupational Violence Policy and Plan. The Directorate annually reviews emergency management frameworks and plans. Evacuation and lock down exercises are undertaken on a regular basis. Through the Protective Security Policy Framework the Directorate has programs, policies and procedures in place to continue to improve the safety of students, staff, families, visitors and contractors.
5. Inadequate information management and storage.
In 2017 the Directorate has undertaken an information security threat assessment and information security risk assessment. The Directorate ensures that assessments and certification of third party providers are in alignment with Territory Privacy and Security Requirements. The Directorate has utilised the Australian Signals Directorate Information Security Registered Assessors Program (I-RAP) and Threat Risk Assessments for software and cloud systems.
6. Deficient and disproportionate asset management planning and investment.
The Directorate conducts strategic asset management planning; provides timely advice to government about risks and associated remediation options and has focused investment on core issues – such as heating and cooling systems and electrical works.
7. Lack of data analysis, systems and tools to inform good decision making and improve system performance.
Over the period, the Directorate has increased the visibility of data for decision making and has developed a tiered approach to evidence access and analysis. The Directorate has provided masterclasses for school leaders as they develop their strategic plans (focusing on the schools that have just completed school review) and developed a professional learning program to provide guidance and support for schools. The Directorate has established performance indicators with a clear line of sight between government priorities and achievements in each school based on student performance data over time. The Directorate is continuing to build agency-wide evaluation expertise and skills.
Accounting Changes
There were no significant accounting changes that impacted the 2017-18 financial statements.
Directorate Financial Performance
The Directorate has managed its operations within the 2017-18 budgeted appropriation. During the financial year, the Directorate achieved savings targets and internally managed cost pressures associated with increased enrolments including increases in numbers of students with a disability.
The table below provides a summary of the financial operations based on the audited financial statements for 2016-17 and 2017-18.
Table C1.1: Net cost of services
Net Cost of Services | Actual 2017-18 $m | Original Budget 2017-18 $m | Actual 2016-17 $m |
|---|---|---|---|
Total expenditure | 780.8 | 781.9 | 728.9 |
Total own source revenue1 | 43.5 | 42.4 | 42.2 |
Net cost of services | 737.3 | 739.5 | 686.7 |
1.Relates to Total Revenue excluding Controlled Recurrent Payments.
Net Cost of Services
The Directorate’s net cost of services for 2017-18 of $737.3 million was $2.2 million or 0.3 percent lower than, and materially in line with, the 2017-18 original budget of $739.5 million.
In comparison to 2016-17, the net cost of services in 2017-18 increased by $50.6 million. The net increase is primarily due to additional employee expenses associated with staff wage and salary increases, an increase in learning professionals and administrative staff numbers to meet enrolment growth, along with increased depreciation expense due to the flow on effect of the revaluation of the Directorate’s land and building assets late in 2016-17, and increased repairs and maintenance expenditure.
Operating Result
In 2017-18, the operating deficit for the Directorate was $75.1 million and was $5.6 million or 8 percent greater than the original budget deficit of $69.5 million. The variance was primarily due to increased expenditure related to Directorate cash funded initiatives, in addition to increased expenditure related to enrolment growth in ACT Public schools and repairs and maintenance.
The 2017-18 total comprehensive deficit totalled $83.1 million which comprises the 2017-18 operating deficit of $75.1 million and a decrease in the Asset Revaluation surplus due to the impairment of Campbell Primary School and Narrabundah College, due to the demolition of buildings at each school.
Total Revenue
Components of Revenue
The Directorate’s revenue for 2017-18 totalled $705.6 million. The main source of revenue for the Directorate is Controlled Recurrent Payments.
Figure C1.1: Components of Revenue 2017-18
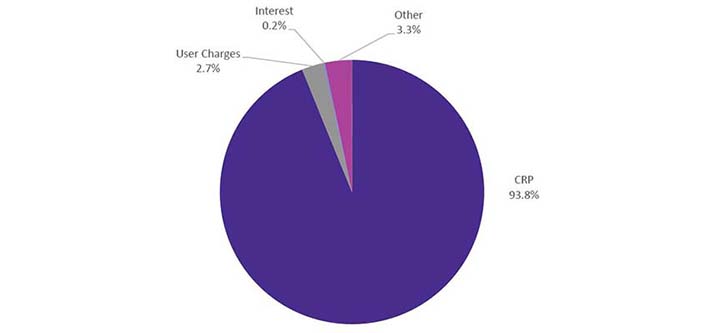
Source: Education Directorate’s 2017-18 Financial Statements.
The Directorate’s revenue for 2017-18 ($705.6 million) was $6.8 million or 1 percent lower than the original budget ($712.4 million), which is materially in line. In comparison to the 2016-17 actual, revenue increased by $35.3 million or 5.3 percent.
The increased revenue from 2016-17 is primarily due to additional funding received for increased salaries and wages associated with the enterprise agreements for teaching and non-teaching staff combined with increased funding for enrolment growth, Commonwealth grants and funding related to new initiatives. The increase has been partially offset by reduced costs related to workers’ compensation insurance and superannuation due to a changing workforce profile.
Total Expenses
Components of Expenses
Expenses for the Directorate totalled $780.8 million for 2017-18. As shown in Figure C1.3, the main component of expenses is employee expenses, including superannuation.
Figure C1.2: Components of Expenditure 2017-18
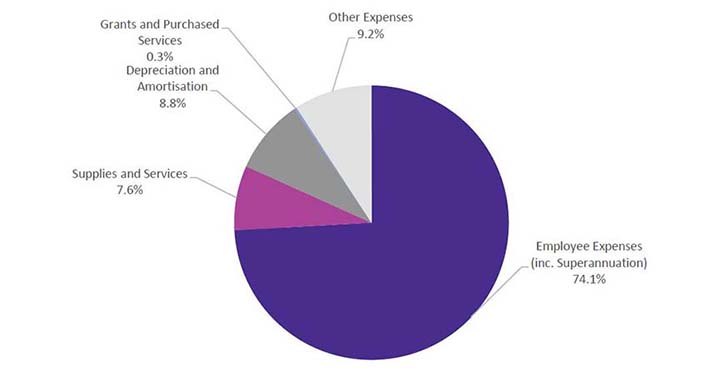
Source: Education Directorate’s 2017-18 Financial Statements
In 2017-18, total expenses of $780.8 million were $1.1 million or 0.1 percent lower than the original budget of $781.9 million which is materially in line. Higher expenditure related to additional employee costs associated with enrolment growth in ACT Public schools and repairs and maintenance, were more than offset by lower costs relating to workers compensation insurance and superannuation costs due to changing workforce profile.
Total expenses were $51.9 million higher than the previous year ($728.9 million). The increase primarily relates to additional employee expenses associated with enterprise agreements for teaching and non-teaching staff, enrolment growth and expenditure linked to new and cash funded initiatives, along with increased depreciation expense due to the flow on effect of the revaluation of the Directorate’s land and building assets late in 2016-17, and increased repairs and maintenance expenditure.
Table C1.2: Line item explanation of significant variances from the amended budget – Controlled operating statement
Actual 2017-18 $m | Original Budget 2017-18 $m | Variance $m 1 | |
|---|---|---|---|
Revenue
|
| ||
Controlled Recurrent Payments 2 | 662.1 | 670.1 | (8.0) |
User charges | 19.0 | 18.7 | 0.3 |
Interest and distribution from investments | 1.3 | 1.4 | (0.1) |
Resources received free of charge | 0.7 | 0.7 | - |
Other revenue | 22.6 | 21.5 | 1.1 |
Total Revenue 1
| 705.6 | 712.4 | (6.7) |
Actual 2017-18 $m | Original Budget 2017-18 $m | Variance $m 1 | |
|---|---|---|---|
Expenses | |||
Employee expenses 3 | 506.8 | 501.3 | 5.5 |
Superannuation expenses 4 | 71.9 | 76.9 | (5.0) |
Supplies and services | 59.3 | 62.1 | (2.8) |
Depreciation | 68.8 | 68.0 | 0.8 |
Grants and purchased services | 2.2 | 3.4 | (1.2) |
Other | 71.7 | 70.2 | 1.5 |
Total Expenses 1 | 780.8 | 781.9 | (1.2) |
Notes:
- Figures may not add due to rounding.
- The lower than budgeted Controlled Recurrent Payments primarily relates to lower worker’s compensation costs and rollover of appropriation from 2017-18 to meet anticipated cost of the new non-teaching staff enterprise agreement.
- Higher than anticipated expenditure primarily relates to growth in staff numbers to meet increased student enrolment in ACT public schools.
- Lower than anticipated superannuation expenditure against budget due to changing workforce profile.
Financial Position
Total Assets
Components of Total Assets
The Directorate held most of its assets in property, plant and equipment including capital works in progress.
Figure C1.3: Total Assets at 30 June 2018
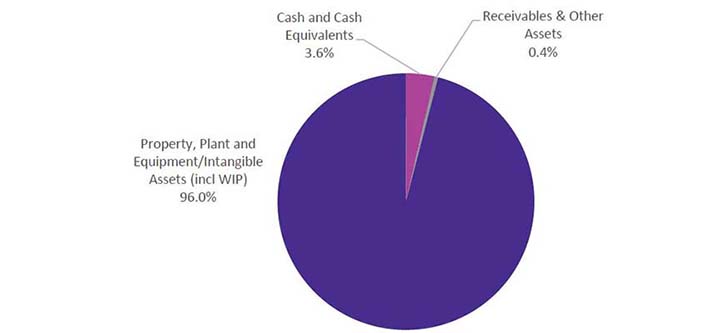
Source: Education Directorate’s 2017-18 Financial Statements.
Comparison to Budget
At 30 June 2018, the Directorate’s assets totalled $2.0 billion, which was materially in line with the 2017-18 original budget.
In comparison to 30 June 2017, total assets increased by $18.6 million or 0.9 percent primarily due to the addition of capital works projects to the Directorate’s assets base.
Components of Total Liabilities
The Directorate’s liabilities comprised mostly of employee benefits.
Figure C1.4: Total liabilities at 30 June 2018

Source: Education Directorate’s 2017-18 Financial Statements.
At 30 June 2018, the Directorate’s liabilities totalled $167.7 million. This was $3.6 million or 2.2 percent higher than the amended budget of $164.1 million primarily due to an increase in capital works related creditors and employee benefits, offset by lower than anticipated revenue received in advance from International Private Students.
In comparison to 30 June 2017, total liabilities increased by $5.9 million or 3.7 percent primarily relating to an increase in employee benefits due to increased wage and salary related expenditure.
Current Assets to Current Liabilities
At 30 June 2018, the Directorate’s current assets ($79.7 million) were lower than its current liabilities ($151.8 million). The Directorate does not consider this as a liquidity risk as working capital needs are funded through appropriation from the ACT Government on a cash needs basis.
The Directorate’s current liabilities primarily relate to employee benefits, and while the majority are classified under a legal entitlement as current, the estimated amount payable within 12 months is significantly lower and can be met with current assets. In addition, in the event of high termination levels requiring significant payment for leave balances, the Directorate is able to meet its obligations by seeking additional appropriation under Section 16A of the Financial Management Act 1996.
Table C1.3: Line item explanation of significant variances from the amended budget – Controlled balance sheet
Variance from budget | Actual 30 June 2018 $m | Original Budget 30 June 2018 $m | Variance $m1 |
|---|---|---|---|
Current assets |
|
|
|
Cash and cash equivalents 2 | 72.4 | 79.4 | (7.0) |
Receivables | 5.4 | 3.3 | 2.1 |
Investments | 0.3 | 0.3 | - |
Other Assets | 1.6 | 1.4 | 0.2 |
Total current assets | 79.7 | 84.4 | (4.7) |
Non-current assets |
|
|
|
Investments | 1.9 | 1.9 | - |
Property, plant and equipment and intangible assets (including capital works in progress) 3 | 1,937.8 | 1,928.8 | 9.0 |
Total non-current assets | 1,939.7 | 1,930.7 | 9.0 |
Total assets1 | 2,019.3 | 2,015.1 | 4.2 |
Actual 30 June 2018 $m | Original Budget 30 June 2018 $m | Variance $m1 | |
|---|---|---|---|
Current liabilities | |||
Payables | 7.6 | 4.4 | 3.2 |
Employee benefits 4 | 138.3 | 137.5 | 0.8 |
Other liabilities | 5.9 | 7.3 | (1.4) |
Total current liabilities | 151.8 | 149.2 | 2.6 |
Non-current liabilities | |||
Employee benefits | 12.5 | 11.7 | 0.8 |
Other borrowings | 3.4 | 3.2 | 0.2 |
Total non-current liabilities | 15.9 | 14.9 | 1.0 |
Total liabilitites1 | 167.7 | 164.1 | 3.6 |
Notes:
- Figures may not add due to rounding.
- Decrease primarily related to increased Directorate cash funded initiatives, offset by increase in school cash balances.
- Increase primarily relates to capitalisation of capital works projects.
- Primarily due to the increased expenditure related to wages and salaries and accrual.
Territorial Statement of Revenue and Expenses
Territorial Revenue
Total income received included revenue for expenses on behalf of the Territory, primarily for the provision of grants to non-government schools.
Figure C1.5: Sources of Territorial Revenue
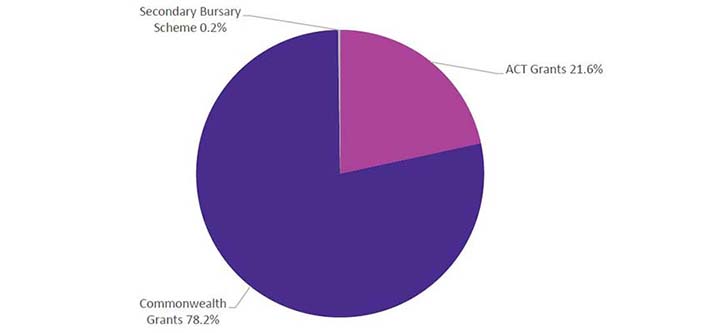
Source: Education Directorate’s 2017-18 Financial Statements.
Territorial revenue is mainly comprised of funding for non-government schools from the Commonwealth and ACT Government. It also included ACT Government funding for the Secondary Bursary Scheme.
Territorial revenue totalled $296.1 million in 2017-18, which was $12.0 million or 4.3 percent higher than original budget of $284.1 million. The increase in revenue primarily related to Australian Government grants reflecting the impact of the National Education Reform Agreement: Australian Capital Territory Bilateral Agreement’s ‘Schooling Resource Standard’ (NERA SRS).
When compared to the same period last year, total revenue increased by $23.4 million or 8.6 percent primarily due to higher levels of general recurrent grants for non‑government schools reflecting the impact of increased NERA SRS.
Territorial Expenses
Territorial expenses primarily comprised of grant payments to non-government schools ($296.1 million). Territorial expenses in 2017-18 were $6.8 million or 2.3 percent higher than amended budget. The increase in revenue primarily related to the NERA SRS.
When compared to the same period last year, total expenses increased by $23.4 million or 8.6 percent primarily due to higher levels of general recurrent grants for non‑government schools reflecting the impact of increased Commonwealth and ACT Government grants in accordance with the NERA SRS.
For further information contact:
Chief Finance Officer
Strategic Finance
Telephone: (02) 6205 2685