
General overview
Objectives
The Directorate works in partnership with parents and the community to ensure students are supported and engaged to achieve their full potential. The Directorate will work closely with the community to position the ACT as Australia's lifelong learning capital.
Services of the Directorate include the provision of public school education, preschool and early intervention education programs, registration of non-government schools, registration for home education, and the planning and coordination of vocational education and training. The Directorate aims to ensure that all young people in the ACT learn, thrive and are equipped with the skills to lead fulfilling, productive and responsible lives.
Risk management
The development of the Directorate's annual Strategic Risk Management and Audit Plan identified risks that could impact on the Directorate's operations and objectives. The key risks provided below are medium to long-term risks that require ongoing monitoring and attention by the Directorate's executive and senior management.
Key risks include:
- The ongoing attraction and retention of high quality staff and the provision of a safe, inclusive and productive workplace needs to be a focus in the context of the contemporary labour market and changes to the ACT Public Service.
- Increasing demand for the integration of ICT systems as part of educational programs. Assessment of ICT systems must take into account compatibility with existing systems, technological advances, future demands and value for money. The Directorate has an ICT Committee to develop strategic plans and oversee implementation of change management policies.
- Delivery of education reforms under COAG agreements in a timely, effective and transparent manner. The Directorate has identified strategies to mitigate the risks particular to each COAG reform.
Accounting issues
There has been no significant change in the accounting standards applicable to the Directorate's 2011-12 financial statements.
There has been a change in the accounting estimates for the calculation of the Directorate's long service leave provision which has had a significant impact on the Directorate's financial statements. In 2011-12, a rate of 106.6 percent was used to calculate the present value of the estimated future payments in comparison with 92.2 percent in 2010-11. The change in the rate used to estimate the present value significantly increased the employee benefits in the Balance Sheet, having a flow-on impact on employee expenses and the operating result.
The change in estimate was in accordance with accounting standards and was primarily due to a reduction in interest rates.
Supplementary appropriation
In 2011-12, the Directorate received supplementation funding of $8.5 million through a second appropriation bill relating to teaching and non-teaching enterprise bargaining agreements.
The new teaching enterprise bargaining agreement provided an average of 5.3 percent pay increase in 2011-12 followed by 3.0 and 4.0 percent in the next two years. The non-teaching enterprise bargaining agreement reflected a pay rise of 3.5 percent in 2011-12 and 2012-13.
For the purposes of the management discussion and analysis, the original budget will be amended to incorporate the supplementary appropriation.
Directorate financial performance
Overall, the Directorate managed its activities within the 2011-12 appropriation. During this financial year, the Directorate faced cost pressures relating to increased enrolment growth, temporary relocation of Taylor Primary School and the provision of special needs transport. The Directorate managed these cost pressures through internal mitigation strategies.
Table A5.1 provides the financial information based on audited financial statements for 2010-11 and
2011-12.
Table A5.1: Net cost of services
|
|
Actual |
Amended Budget 1 |
Actual |
|
Total expenditure |
627.4 |
629.7 |
587.9 |
|
Total own source revenue |
37.2 |
35.2 |
39.7 |
|
Net cost of services |
590.2 |
594.5 |
548.2 |
Source: ACT Education and Training Directorate financial statements
Note:
- The original budget was amended to reflect the supplementary appropriation provided in 2011-12 totalling $8. 5million.
The Directorate's net cost of services in 2011-12 decreased from the amended budget by $4.3 million or 0.7 percent. The lower than anticipated costs primarily related to the timing of expenditure associated with national partnership programs such as Productivity Places Program, Youth Attainment and Transitions, Literacy and Numeracy and Improving Teacher Quality combined with superannuation and other savings. The lower than anticipated expenditure was offset by the increase in employee expenses due to a change in the rate used to calculate the present value of long service leave, an enrolment growth of 1,064 students in 2012, cost increases for special needs transport and the transfer of the Red Hill Preschool to the Economic Development Directorate.
In comparison with 2010-11, there was a significant increase in the net cost of services by $42.0 million or 7.7 percent. Higher levels of expenditure primarily related to additional costs associated with new enterprise bargaining agreements for teaching and non-teaching staff, change in long service leave provision, increase in teacher numbers to meet enrolment growth, impact of national partnership programs, increased depreciation associated with higher levels of capital investment particularly in new schools and asset revaluation.
The increase was partially offset by the rollover of unspent appropriation from the previous year associated with national partnership programs funding relating to Literacy and Numeracy and Productivity Places Program, combined with the transfer of Birrigai at Tidbinbilla infrastructure to the Territory and Municipal Services Directorate in 2010-11.
Operating deficit
The 2011-12 financial statements provided an operating deficit of $74.2 million for the Directorate. This represented $14.1 million or 23.5 percent higher than the amended budget and $27.2 million or 58.0 percent higher than 2010-11.
Figure A5.1: Operating result
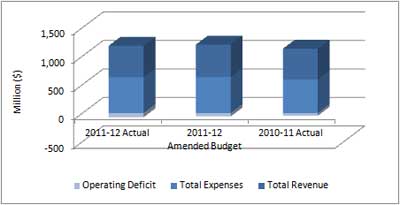
Source: Education and Training Directorate financial statements
The higher than expected operating deficit against the amended budget mainly related to increased employee expenses due to a change in long service leave, as a result of a change in accounting estimate and wage increases from the teaching and non-teaching enterprise bargaining agreements.
In comparison with 2010-11, an increase in operating result primarily related to higher levels of employee expenses as explained above combined with increased depreciation due to higher levels of capital investment and asset revaluation.
Revenue
In 2011-12, the Directorate's revenue totalled $553.3 million, which was $16.4 million or 2.9 percent lower than the amended budget. In comparison with 2010-11, revenue increased by $12.3 million or 2.3 percent.
Figure A5.2: Revenue
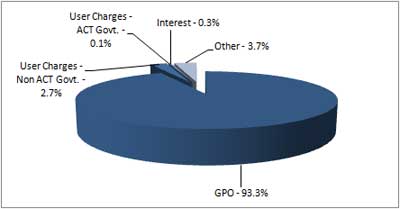
Source: Education and Training Directorate financial statements
The lower than anticipated revenue of $16.4 million from the amended budget primarily related to the rollover of unspent Government Payments for Outputs (GPO) appropriation from 2011-12 to 2012-13 for national partnership programs such as Productivity Places Program, Youth Attainment and Transitions, Improving Teacher Quality and Literacy and Numeracy. Further reduction in revenue related to superannuation and other savings partially offset by higher than budgeted levels of schools revenues primarily relating to activities such as overseas excursions and hire of facilities.
Increased revenue from 2010-11 mainly related to additional funding associated with the new enterprise agreements for teaching and non-teaching staff and budget initiaitves relating to students with special needs, digital learning and flow on impact of operational funding relating to Gungahlin College and Namadgi School. This was partially offset by the rollovers of unspent funding from the previous year associated with national partnership programs and savings initiaitves.
Expenses
In 2011-12, expenditure totalled $627.4 million and comprised of employees costs, supplies and services, grants and purchased services, depreciation, schools and borrowing costs. According to Figure A5.3, employee related expenses including superannuation comprised 69 percent of the total expenditure.
Figure A5.3 Expenses
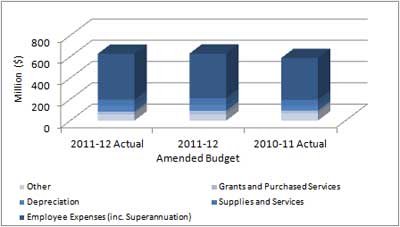
Source: Education and Training Directorate financial statements
Total expenditure was $2.3 million or 0.4 percent lower than the amended budget primarily due to lower than anticipated expenditure for national partnership Programs such as Productivity Places Programs, Youth Attainment and Transitions, Improving Teacher Quality and Literacy and Numeracy, and superannuation and other savings. This was partially offset by higher than anticipated employee costs due to a change in the rate used to calculate the present value of long service leave, enrolment growth, special needs transport and the transfer of the Red Hill Preschool to the Economic Development Directorate.
In comparison with the previous year, total expenditure increased by $39.7 million or 6.8 percent mainly relating to additional costs associated with new enterprise bargaining agreements for teaching and
non-teaching staff, the impact of the change in the rate used to calculate the present value of long service leave, enrolment growth, higher levels of Commonwealth grants and increased depreciation due to higher levels of capital investment and asset revaluation.
The increase was offset by the rollover of unspent appropriation from the prior year associated with national partnership programs, in particular relating to Productivity Places Program and Literacy and Numeracy, combined with the transfer of Birrigai at Tidbinbilla infrastructure to the Territory and Municipal Services Directorate in 2010-11.
Table A5.2: Line item explanation of significant variances from the amended budget – Directorate operating statement
|
Main areas of variance from the budget |
Actual |
Amended Budget 1 |
Variance |
|
Total revenue |
553.3 |
569.7 |
(16.4) |
|
Government Payment for Outputs 2 |
516.1 |
534.4 |
(18.3) |
|
User Charges – ACT Government 3 |
0.4 |
0.1 |
0.3 |
|
User Charges – Non ACT Government 4 |
14.9 |
16.2 |
(1.3) |
|
Interest |
1.7 |
1.7 |
- |
|
Resources received free of charge |
0.4 |
0.3 |
0.1 |
|
Other Revenue 5 |
19.8 |
17.0 |
2.8 |
|
Total expenditure |
627.4 |
629.7 |
(2.3) |
|
Employee expenses 6 |
376.7 |
365.2 |
11.5 |
|
Superannuation expenses 7 |
53.4 |
54.8 |
(1.4) |
|
Supplies and services 8 |
57.4 |
62.8 |
(5.4) |
|
Depreciation9 |
55.8 |
54.6 |
1.2 |
|
Grants and purchased services 10 |
25.1 |
34.0 |
(8.9) |
|
Other 11 |
59.1 |
58.3 |
0.8 |
Source: ACT Education and Training Directorate financial statements
Notes:
- The original budget is amended to reflect the supplementary appropriation provided in 2011-12 totalling $8.5m.
- Reduction primarily relates to the timing of expenditure associated with national partnership programs, with the unspent appropriation being rolled over for expenditure in 2012-13. These national partnership programs primarily related to Productivity Places Program, Youth Attainment and Transitions, Improving Teacher Quality, Literacy and Numeracy, Empowering Local Schools and Student with Disabilities. The appropriation is further reduced by superannuation and other savings.
- Higher than anticipated revenue relates to specific purpose grants relating to Mental Health initiative and Health Curriculum funded by the Health Directorate.
- Decrease primarily relates to Commonwealth Own Purpose grants relating to Industry Skill Centres and Joint Group Training which have been funded as national partnership programs in 2011-12. Funding for these programs has been provided to the Directorate as Government Payments for Outputs.
- Higher than anticipated revenue mainly relates to schools activities primarily associated with excursions and hire of facilities.
- Increase primarily relates to change of employee provisions due to a change in long service leave estimates, increased provisions resulting from the teaching and non-teaching enterprise bargaining agreements, and enrolment growth. This is partially offset by rollover of national partnership programs and lower than anticipated casual salaries.
- Lower than anticipated costs compared to budget relate to superannuation savings due to reduced numbers of employees in higher cost superannuation schemes including the CSS and PSS.
- Decrease relates to timing of expenditure associated with national partnership programs and other specific projects, reduced costs associated with ICT and professional development funds. This is partially offset by increased costs associated with special needs transport.
- Higher than anticipated expenditure mainly relates to the impact associated with asset revaluation.
- Reduction primarily relates to timing of expenditure associated with Productivity Places Programs, Youth Attainment and Transition, Industry Skill Centres and Joint Group Training programs.
- Increase mainly relates to the transfer of the Red Hill Preschool to the Economic Development Directorate, partially offset by timing of schools expenditure associated with excursions.
Total assets
The Directorate held 95 percent of its assets in property, plant and equipment, and 5 percent related to cash and cash equivalents, capital works in progress, receivables and other current assets.
Figure A5.4 Total Assets
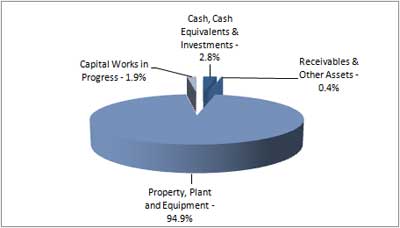
Source: Education and Training Directorate financial statements
In 2011-12, assets totalled $1,979.6 million. This represented a decrease of $144.1 million or 6.8 percent over budget mainly due to the flow-on impact from 2010-11 audited outcome in relation to asset revaluation and deferral of capital works projects to 2012-13, combined with timing of expenditure associated with the Commonwealth Digital Education Revolution and schools bank balances.
Total assets increased by $40.2 million or 2.1 percent from the same period last year primarily due to the completion of capital works projects, higher levels of cash associated with timing of payments and also reflected by high levels of liabilities. The increase was partially offset by depreciation, impairment of Taylor Primary School and transfer of the Red Hill Preschool to the Economic Development Directorate.
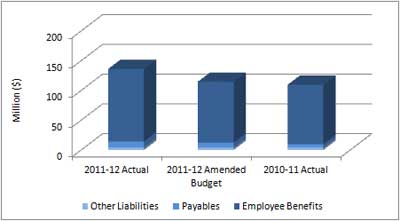
Total liabilities
The Directorate's liabilities comprised of employee benefits, payables finance leases and make good provision. The majority of the Directorate's liabilities related to employee benefits (89.6 percent) and payables (7.5 percent).
Figure A5.5 Total liabilities
Source: Education and Training Directorate financial statements
At 30 June 2012, liabilities for the Directorate totalled $136.0 million. This represented an increase of $21.5 million or 18.7 percent over the amended budget, primarily due to increase in employee benefits associated with the change in the rate used to calculate long service leave and increased provisions resulting from the new enterprise bargaining agreement for teaching and non-teaching staff.
In comparison with 2010-11, total liabilities increased by $26.7 million or 24.4 percent primarily associated with employee benefits as discussed above combined with increase in payables/accruals mainly relating to capital works.
Table A5.3: Line item explanation of significant variances from the amended budget - Directorate balance sheet
|
Main areas of variance from the budget |
Actual |
Amended Budget 1 |
Variance |
|
Current assets |
|||
|
Cash and cash equivalents 2 |
53.7 |
36.7 |
17.0 |
|
Receivables 3 |
4.6 |
7.1 |
(2.5) |
|
Other current assets |
2.7 |
2.7 |
- |
|
Non-current assets |
|||
|
Investment |
1.8 |
1.8 |
- |
|
Property, plant and equipment 4 |
1,878.3 |
2,042.1 |
(163.8) |
|
Capital works in progress 5 |
38.5 |
33.2 |
5.3 |
|
Current liabilities |
|||
|
Payables 6 |
10.1 |
8.1 |
2.0 |
| Finance leases |
0.1 |
0.1 |
- |
|
Employee benefits 7 |
111.3 |
90.2 |
21.1 |
|
Other liabilities |
3.9 |
4.0 |
(0.1) |
|
Non-current liabilities |
|||
|
Finance leases |
- |
0.1 |
(0.1) |
|
Employee benefits7 |
10.6 |
12.1 |
(1.5) |
Source: ACT Education and Training Directorate financial statements
Notes:
- Amended budget is consistent with original budget as no supplementary appropriation was provided.
- The increase primarily relates to higher than anticipated cash balances relating to the Commonwealth Digital Education Revolution program and increased schools bank balances.
- Lower than anticipated levels of receivable mainly relates to the input tax credit from the Australian Taxation Office.
- Decrease in property, plant and equipment primarily relates to the flow-on impact of 2010-11 audited outcome associated with asset revaluation. This is combined with deferral of capital works activities such as Canberra Performing Arts Centre, preschools expansion and ICT projects. This is further reduced by the impairment of Taylor Primary school and transfer of the Red Hill Preschool to the Economic Development Directorate.
- Increase in capital works in progress primarily relates to the timing of completion of capital works projects. The works in progress mainly relates to new school projects for Bonner Primary and Franklin Early Childhoods Schools.
- Higher than anticipated payables primarily relate to capital works accruals for Bonner Primary and Canberra College Performing Arts Centre.
- The higher than anticipated employee benefits is mainly associated with the change in estimates for long service leave and the impact of the new enterprise bargaining agreements for teaching and
non-teaching staff.
Territorial financial performance
Territorial revenue
Total income received includes Revenue for Expenses on Behalf of the Territory, primarily for the provision of grants to non-government schools.
Figure A5.6: Territorial revenue
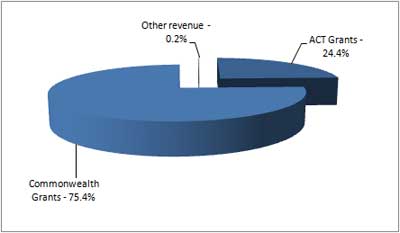
Source: Education and Training Directorate financial statements
Territorial revenue mainly comprised of funding for non-government schools from the Australian and ACT Government. It also included ACT Government funding for the Secondary Bursary Scheme and Block Release Programs.
In 2011-12, Territorial revenue totalled $195.1 million, a decrease of $1.7 million or 0.9 percent from the 2011-12 budget. The decrease in funding primarily related to the rollover of unspent appropriation for interest subsidy scheme funding to 2012-13.
In comparison with 2010-11, total revenue decreased by $17.6 million or 8.3 percent mainly due to the finalisation of the Building the Education Revolution program partially offset by increase in general recurrent grants for non-government schools.
Territorial expenditure
Territorial expenditure other than transfers of fees to the Territorial Banking Account comprised grant payments to non-government schools ($194.7 million), the Secondary Bursary Scheme ($0.3 million) and Block Release grants ($0.1 million).
Lower than anticipated expenditure from the budget primarily related to the rollover of unspent appropriation for interest subsidy scheme funding to 2012-13.
In 2011-12, expenditure decreased by $17.6 million or 8.3 percent from 2010-11 mainly due to the finalisation of the Building the Education Revolution program partially offset by increase in general recurrent grants for non-government schools.
For more information, contact:
Director
Finance and Corporate Support
(02) 6205 9108