In January 2010 the Directorate launched its Strategic Plan 2010-2013: Everyone matters. The Strategic Plan provides direction to the organisation, and informs its clients and stakeholders about key priorities. Specifically, the plan identifies four priority areas: learning and teaching; school environment; student pathways and transitions; and leadership and corporate development.
Under these priority areas performance indicators have been identified to allow for monitoring of progress over time.
Learning and teaching
'To ensure students succeed through quality teaching that engages them and supports the development of capabilities for life'
Year 12 attainment and completion
Attainment of year 12 or equivalent qualification is recognised as a key to better employment outcomes and social inclusion. It is one of the three strategic targets identified by the Council of Australian Governments for education reform in Australia.
Box A8.1: Year 12 attainment
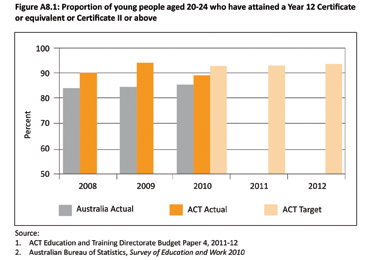
The proportion of the 20-24 year old population having attained at least a year 12 or equivalent qualification (Australian Qualifications Framework certificate II or above) is calculated as the number of 20-24 year olds that self-identify as having attained a year 12 or equivalent qualification divided by the estimated potential year 12 population (an estimate of a single year age group which could have attended year 12 that year, calculated as the estimated resident population aged 15-19 divided by five).
The proportion of the 20-24 year old population having attained at least a year 12 or equivalent qualification is obtained from the ABS Survey of Education and Work (SEW). The 2010 SEW was conducted in May 2010 with the results released in November 2010.
A data quality statement on this measure can be obtained from http://www.pc.gov.au/__data/assets/pdf_file/0016/103345/education-agreement-2009.pdf
The ACT has the highest proportion of year 12 attainment in Australia. Figure A8.1 shows that for the last three years, the ACT's proportion of 20-24 year olds who attained a year 12 or equivalent qualification remained higher (approximately 90%) than the national average (approximately 85%).
Year 12 completion
Box A8.2: Year 12 completion
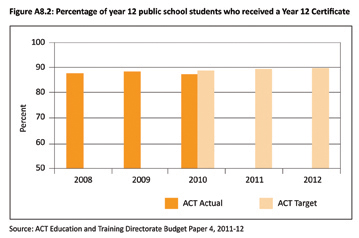
Year 12 completion is the number of students who meet the requirements of a Year 12 Certificate or equivalent expressed as a percentage of year 12 enrolments. Data is obtained from the Board of Senior Secondary Studies and the Directorate School Census in February.
Estimates are calculated based on the number of students completing the requirements of the ACT Year 12 Certificate divided by the number of year 12 students as per ACT School Census, February of the reference year.
Figure A8.2 shows that the ACT public school completion rate for year 12 was 87 percent in 2010, slightly below the target of 88.5 percent. To improve secondary schooling in the ACT, the Directorate has undertaken a number of activities, detailed in the Excellence and Enterprise publication released in May 2011. This will assist in engaging and retaining students to year 12 and increasing the completion rate. There is no comparable data at the national level.
School environment
'To meet each student's academic, social, emotional and physical needs by ensuring all ACT public schools provide positive and success-oriented learning environments'
Student attendance
Attendance at school is essential for learning and for enabling students to benefit from the full range of educational programs offered at school.
Box A8.3: Student attendance
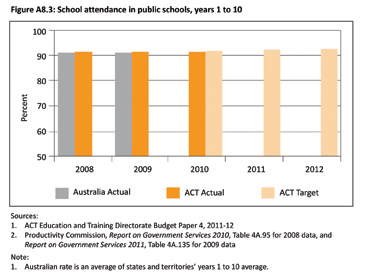
Student attendance rate is the number of actual full-time equivalent student-days attended by full-time students in years 1 to 10 as a percentage of the total number of possible student-days attended over the period.
Attendance is recorded for the first semester in the reporting year.
Attendance data are collected through the electronic school management system at the school. For primary school attendance data, teachers record student attendance daily (to the level of half day attendance). High school attendance data are recorded at each teaching period and entered into the electronic school management system. Absence data are aggregated at the end of each term and entered in the school management system. The school management system is included into the central database.
A data quality statement on this measure can be obtained from www.pc.gov.au/gsp/reports/rogs
The attendance rate of public school students from years 1 to 10 was 91.7 percent in 2010, compared with 91.4 percent in 2009 (Figure A8.3). The Directorate, through the School Improvement Framework, has set in place strategies to increase the attendance and engagement of students, particularly at high school and college.
The national attendance rate for public schools in 2009 (latest available data) was similar to the previous year at 91 percent, slightly lower than the ACT's attendance rate.
Student satisfaction
Student satisfaction is an important indicator of student engagement leading to positive learning outcomes.
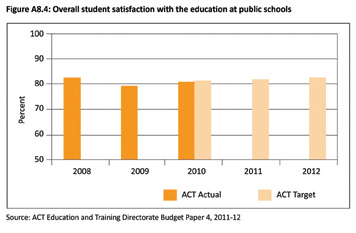
Box A8.4: Student satisfaction
Student satisfaction is based on a survey of students from years 5 to 12 at ACT public schools, excluding students at specialist schools. The survey is conducted in May and June each year. Responses are sought from primary and high school students to 34 questions and to 36 questions for college students. The questions are grouped according to the four domains of school improvement: teaching and learning, leading and managing, student environment and community involvement, as well as a group of questions relating to overall satisfaction.
In determining overall student satisfaction, the question 'Overall I am satisfied I am getting a good education at this school' is used. Responses are collected on a five point scale with only statements of 'agree' or 'strongly agree' used to calculate overall satisfaction rates.
In 2010, 13,782 students responded to the survey.
From 2008 to 2010, overall student satisfaction (across primary, high and college sectors) with the quality of the education received at public schools has remained around 80 percent (Figure A8.4). There is no nationally consistent comparative data.
Student pathways and transitions
'To provide learning pathways for students resulting in an educated and skilled work- force that meets the present and future needs of the ACT and region'
Student destination
The proportion of year 12 graduates engaged in study or employment six months after completing year 12 reflects performance of the educational system in preparing students for further study or employment.
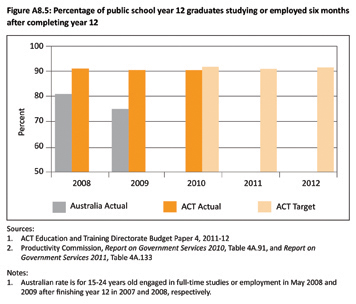
Box A8.5: Student destination post-school
Destination data is based on a survey of graduates who successfully complete year 12 in the ACT. Graduates from the previous year are surveyed in May of the reference year.
The survey frame is drawn from the Board of Senior Secondary Studies administrative records and the population of interest is defined as those graduates who were awarded a Year 12 Certificate from an ACT college, school or the Canberra Institute of Technology. The population excludes graduates who are full-fee paying students and graduates whose usual residence was overseas.
There were 4,026 year 12 graduates in 2009. Of these, 3,560 graduates were contacted for the survey. Contact was made between 15 July and 12 August 2010. There were 2,908 graduates who completed the survey, providing a response rate of 81.7 percent.
As shown in Figure A8.5, more than 90 percent of the 2008 and 2009 ACT public school year 12 graduates were engaged in tertiary studies or employment in 2009 and 2010, respectively.
Nationally, the percentage of 2008 year 12 graduates who were studying or employed full-time in 2009 was 74.5 percent compared with 80.7 percent of 2007 year 12 graduates studying or employed full-time in 2008.
Leadership and corporate development
'To ensure that the Directorate is recognised as a responsive, innovative and high- achieving organisation that delivers on its commitments'
Parent and carer satisfaction
The satisfaction of parents and carers with education in public schools shows the confidence of stakeholders in the educational policies and performance of the Directorate.
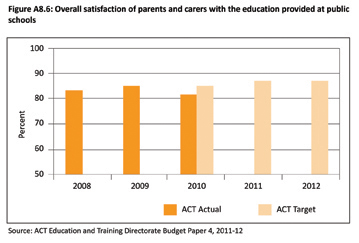
Box A8.6: Parent and carer satisfaction
Parent and carer satisfaction is based on a survey of parents and carers of students attending ACT public schools. The survey is conducted in May and June each year. Responses are sought from parents and carers to 15 questions. The questions are grouped according to the four domains of school improvement: teaching and learning, leading and managing, student environment and community involvement, as well as a group of questions relating to overall satisfaction.
In determining overall parent and carer satisfaction, the question 'Overall I am satisfied with my child's education at this school' is used. Responses are collected on a five point scale with only statements of 'agree' or 'strongly agree' being used to calculate overall satisfaction rates.
In 2010, 8,504 parents and carers of students responded to the survey.
Figure A8.6 indicates that the Directorate enjoyed a high level of parent and carer satisfaction in 2010 (over 80%). To engage parents and carers and improve their satisfaction with education services, the Directorate established the Community Liaison section in 2010. There is no nationally consistent comparative data on parent and carer satisfaction.
Staff retention
Staff retention is an indicator of the health of an organisation.
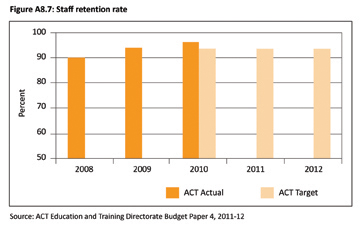
Box A8.7: Staff retention
The staff retention rate is expressed as a percentage of all staff retained in the financial year.
The rate is calculated by dividing the number of permanent staff employed at 30 June of the preceding year plus the number of commencements during the financial year, minus the number of separations in the same financial year, by the number of staff at 30 June of the preceding year and commencements during the financial year.
The indicator is based on the headcount of all permanent school-based and office- based staff in all classification streams. Staff on long service leave are excluded from these counts.
The Directorate has historically maintained a high staff retention rate with 94 percent for 2010, slightly up from 2009 (Figure A8.7). This high retention rate indicates staff satisfaction with management and a commitment to achieving corporate goals. There is no nationally consistent comparative data.