
General overview
Objectives
The Directorate works in partnership with the community to provide sustainable, high quality school education and training services to meet the needs of the people of Canberra.
Directorate services include the provision of public school education; preschool and early intervention education programs, registration of non-government schools; registration for home education; planning and coordination of vocational education and training. The Directorate aims to ensure that all young people in the ACT learn, thrive and are equipped with the skills to lead fulfilling, productive and responsible lives.
Risk management
The development of the Directorate's annual Strategic Risk Management and Audit Plan identified risks that could impact on Directorate operations and objectives. The key risks provided below are medium to long-term risks that require ongoing monitoring and attention by the Directorate's executive and senior management.
Key risks include:
- The ongoing attraction and retention of staff due to the high age profile of the Directorate. Risk mitigation strategies, such as active engagement with the whole of government Attraction and Retention project and participation in National programs and partnerships including Improving Teacher Quality and Empowering Local Schools.
- The number of staff injuries and subsequent workers compensation premiums. Participation in the development and implementation of Whole of Government Injury Prevention and Management Framework.
- Delivery of education reforms under the Council of Australian Governments (COAG) agreements in a timely, effective and transparent manner. The Directorate has identified strategies to mitigate the risks particular to each COAG reform.
Accounting issues
There has been no significant change in the accounting standards applicable to the Directorate's 2010-11 financial statements.
Financial performance
In 2010-11, the Directorate managed its activities within the appropriation. During the financial year, the Directorate faced cost pressures relating to students with a disability and special needs transport. The Directorate managed the cost pressures through internal mitigation strategies and by accessing additional funds through a Treasurer's Advance.
Table A5.1 below provides the financial information based on audited financial statements for 2009-10 and 2010-11.
Table A5.1: net cost of services
|
|
Actual |
Budget |
Actual |
|
Total expenditure |
587.9 |
584.5 |
548.9 |
|
Total own source revenue |
39.7 |
36.1 |
35.8 |
|
Net cost of services |
548.2 |
548.4 |
513.1 |
Source: Education and Training Directorate Financial Statements
The Directorate's net cost of services in 2010-11 was lower than budget by $0.2m or 0.1 percent primarily due to lower than anticipated depreciation, timing of payments associated with vocational education and training grants and schools expenditure. The decrease is offset by the transfer of Birrigai at Tidbinbilla infrastructure to the Territory and Municipal Services Directorate.
Net cost of services increased by $35.1m or 6.8 percent from 2009-10 due to additional funding provided for budget initiatives, indexation, increased depreciation associated with higher levels of capital works activities and the transfer of Birrigai at Tidbinbilla infrastructure to the Territory and Municipal Services Directorate.
Operating deficit
The operating deficit for 2010-11 is $46.9m. This is $0.8m or 1.7 percent higher than the 2010-11 original budget and $6.8m or 17 percent higher than 2009-10.
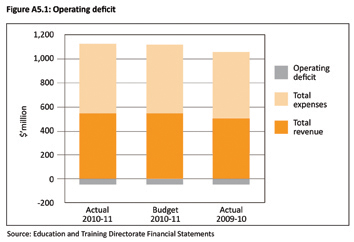
The higher than expected operating deficit against budget primarily related to the transfer of Birrigai at Tidbinbilla infrastructure to the Territory and Municipal Services Directorate, partially offset by increased revenue, lower than anticipated depreciation, timing of expenditure associated with vocational education and training grants as well as schools expenditure.
The increase in operating deficit from 2009-10 was mainly due to transfer of Birrigai at Tidbinbilla infrastructure to the Territory and Municipal Services Directorate, partially offset by timing of expenditure associated with vocational education and training grants as well as schools expenditure.
Revenue
The Directorate’s total revenue of $540.9m, is $2.7m or 0.5 percent higher than budget. In comparison to 2009-10 revenue increased by $32.2m or 6 percent. The Directorate receives 93 percent of funding through Government Payments for Outputs (GPO) as illustrated in Figure A5.2.
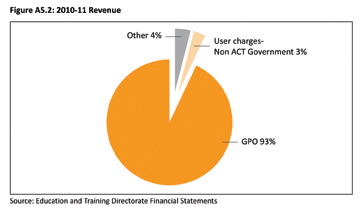
The increase of $2.7m from budget is primarily related to schools revenue and the one-off insurance receipt from ACT Insurance Authority for fire damage to Calwell Primary School library.
The increase from 2009-10 was mainly due to additional funding provided for budget initiatives, wages and salary increases, Commonwealth funds and self generated revenue.
Expenses
In 2010-11, expenditure totalled $587.9m. This is $3.4m or 0.6 percent higher than budget. In comparison to the same period last year, expenditure increased by $39.0m or 7.1 percent. Figure A5.3 shows that 67 percent of total expenses are attributed to employee related expenses including superannuation.
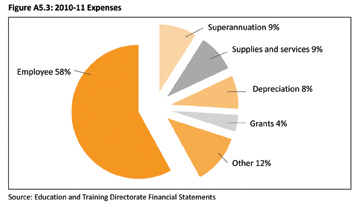
The increase from budget of $3.4m primarily related to the transfer of Birrigai at Tidbinbilla infrastructure to the Territory and Municipal Services Directorate. This is partially offset by lower than anticipated depreciation, timing of payments associated with vocational education and training grants and the timing of schools expenditure.
Higher expenditure from 2009-10 mainly related to the transfer of Birrigai at Tidbinbilla infrastructure to the Territory and Municipal Services Directorate, additional costs associated with budget initiatives, wages and salaries, Commonwealth grants, higher levels of depreciation and schools expenditure.
Table A5.2: Line item explanation of significant variances from budget – Directorate operating statement
|
Main Areas of variance from the budget |
Actual 2010-11 $'m |
Budget 2010-11 $'m |
Variance |
|
Total Revenue |
540.9 |
538.3 |
2.6 |
|
Government Payment for Outputs1 |
501.2 |
502.1 |
(0.9) |
|
User Charges – ACT Government2 |
0.5 |
0.1 |
0.4 |
|
User Charges – Non ACT Government3 |
16.0 |
15.5 |
0.5 |
|
Interest4 |
2.1 |
1.9 |
0.2 |
|
Other Revenue5 |
20.8 |
18.3 |
2.5 |
|
Total Expenditure |
587.9 |
584.5 |
3.4 |
|
Employee expenses6 |
339.9 |
333.7 |
6.2 |
|
Superannuation expenses7 |
52.4 |
51.6 |
0.8 |
|
Supplies and Services8 |
54.5 |
59.0 |
(4.5) |
|
Depreciation9 |
46.8 |
50.4 |
(3.6) |
|
Grants and purchased services10 |
25.3 |
32.4 |
(7.1) |
|
Other11 |
69.0 |
57.4 |
11.6 |
Source: Education and Training Directorate Financial Statements
Notes:
- Reduction primarily relates to rollover of funds associated with productivity places program, national partnership programs, teacher professional development partially offset by increased appropriations provided for special education and superannuation.
- Higher than anticipated revenue relates to specific purpose grants from the Health Directorate.
- Increase primarily relates to operational activities from Active Leisure Centre.
- Higher than anticipated interest primarily relates to interest generated on Commonwealth Government National Partnership for the Digital Education Revolution and Building the Education Revolution.
- Higher than anticipated revenue mainly relates to schools revenue and one-off receipt from ACT Insurance Authority.
- Increase primarily relates to costs associated with students with a disability, Comcare premium and employee provisions.
- Relates to employee profile.
- Decrease relates to lower than anticipated expenditure associated with National Partnership Programs and other specific projects, reduced costs in Information and Communication Technology and is partially offset by special needs transport.
- Lower than anticipated expenditure is primarily due to deferral of capital works activities.
- Reduction primarily relates to timing of expenditure associated with vocational education and training, in particular, Productivity Places Program.
- Increase primarily relates to the transfer of Birrigai at Tidbinbilla infrastructure to the Territory and Municipal Services Directorate.
Total assets
The Directorate held 97 percent of its assets in property, plant and equipment, and 3 percent related to cash and cash equivalents, receivables and other current assets.
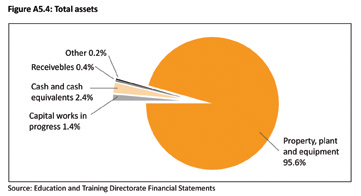
At the end of 30 June 2011 assets totalled $1,939.5m. This represents an increase of $116.3m or 6.4 percent over budget and is primarily due to asset revaluation, increased cash associated with the National Partnership on Digital Education Revolution, partially offset by the transfer of Birrigai at Tidbinbilla infrastructure to the Territory and Municipal Services Directorate.
In comparison to the previous year, total assets increased by $279.7m or 16.9 percent primarily due to asset revaluation, increased capital works activities and higher levels of cash associated with National Partnership on Digital Education Revolution and schools accounts. The increase is offset by depreciation and the transfer of Birrigai at Tidbinbilla infrastructure to the Territory and Municipal Services Directorate.
Total liabilities
Figure A5.5 indicates that the majority of the Directorate's liabilities relate to employee benefits (91.3 percent) and payables (5 percent).
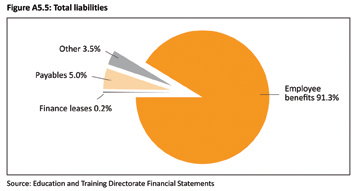
Liabilities for the Directorate totalled $109.3m for the period ending 30 June 2011. This represents an increase of $0.6m or 0.6 percent over budget, which was mainly due to higher than anticipated employee benefits partially offset by payables.
Total liabilities decreased by $1.5m or 1.4 percent from 2009-10 primarily due to payables and finance leases, partially offset by increased employee benefits associated with wage increases.
Table A5.3: Line explanation of significant variances from the amended budget - Directorate balance sheet
|
Main Areas of variance from budget |
Actual |
Budget |
Variance |
|
Current assets |
|||
|
Cash and cash equivalents1 |
45.3 |
37.4 |
7.9 |
|
Receivables2 |
7.1 |
5.0 |
2.1 |
|
Non-current assets |
|||
|
Investment3 |
1.8 |
0.0 |
1.8 |
|
Property, plant and equipment4 |
1854.9 |
1751.9 |
103.0 |
|
Capital works in progress5 |
26.7 |
25.9 |
0.8 |
|
Current liabilities |
|||
|
Payables6 |
5.5 |
6.6 |
(1.1) |
|
Employee benefits7 |
91.3 |
87.4 |
3.9 |
|
Non-current liabilities |
|||
|
Employee benefits7 |
8.5 |
10.9 |
(2.4) |
Source: Education and Training Directorate Financial Statements
Notes:
- Increase primarily relates to funds held for the Commonwealth Digital Education Revolution program.
- Higher level of receivables mainly relates to amount owed by Shared Services Centre for information and communication technology.
- Relates to a re-classification of investment from cash and cash equivalents.
- Increase in property, plant and equipment primarily relates to asset revaluation and capital works activities offset by transfer of Birrigai at Tidbinbilla infrastructure to the Territory and Municipal Services Directorate.
- Increase in capital works in progress primarily relates to the timing of completion of the capital works projects.
- Lower than anticipated payables primarily relates to accruals for capital works due to the completion of major capital works projects including the Building the Education Revolution and general invoices.
- The higher than anticipated employee provisions primarily relates to the impact of revised discount rates for long service leave liability.
Territorial revenue
Total income received includes Revenue for Expenses on Behalf of the Territory, primarily for the provision of grants to non-government schools, and fees from training and regulatory services.
Territorial revenue totalled $212.7m, a decrease of $7.2m or 3.3 percent from the 2010-11 budget. The lower than anticipated revenue primarily related to Commonwealth grants for non-government schools.
Total revenue decreased by $13.0m or 5.7 percent from 2009-10 mainly due to reduced revenue for the Building the Education Revolution program for non- government schools in 2010-11. This program is expected to finish in 2011-12.
Territorial expenditure
Territorial expenditure other than transfers of fees to the Territorial Banking Account comprises grant payments to non-government schools ($212.0m), the junior bursary scheme ($0.4m) and block release grants ($0.1m).
Lower than anticipated expenditure primarily relates to Commonwealth grants for non-government schools.
Expenditure decreased by $13.0m or 5.7 percent from 2009-10 due to expenditure associated with the Building the Education Revolution program for non-government schools in 2010-11. This program is expected to finish in 2011-12.
![]()
For more information contact:
Director
Finance and Corporate Support
(02) 6205 9108